 About: how UpToWhere works
What can you see from here?
UpToWhere answers that question for any point on Earth: it walks real 30-meter terrain data in every direction, subtracts the curvature of the planet, adds back what refraction returns, and maps everything the landscape lets you see.
Open the calculatorWhat it does
Two questions, answered from terrain alone: how far can you see from a point, and can point A see point B.
The 360° viewshed
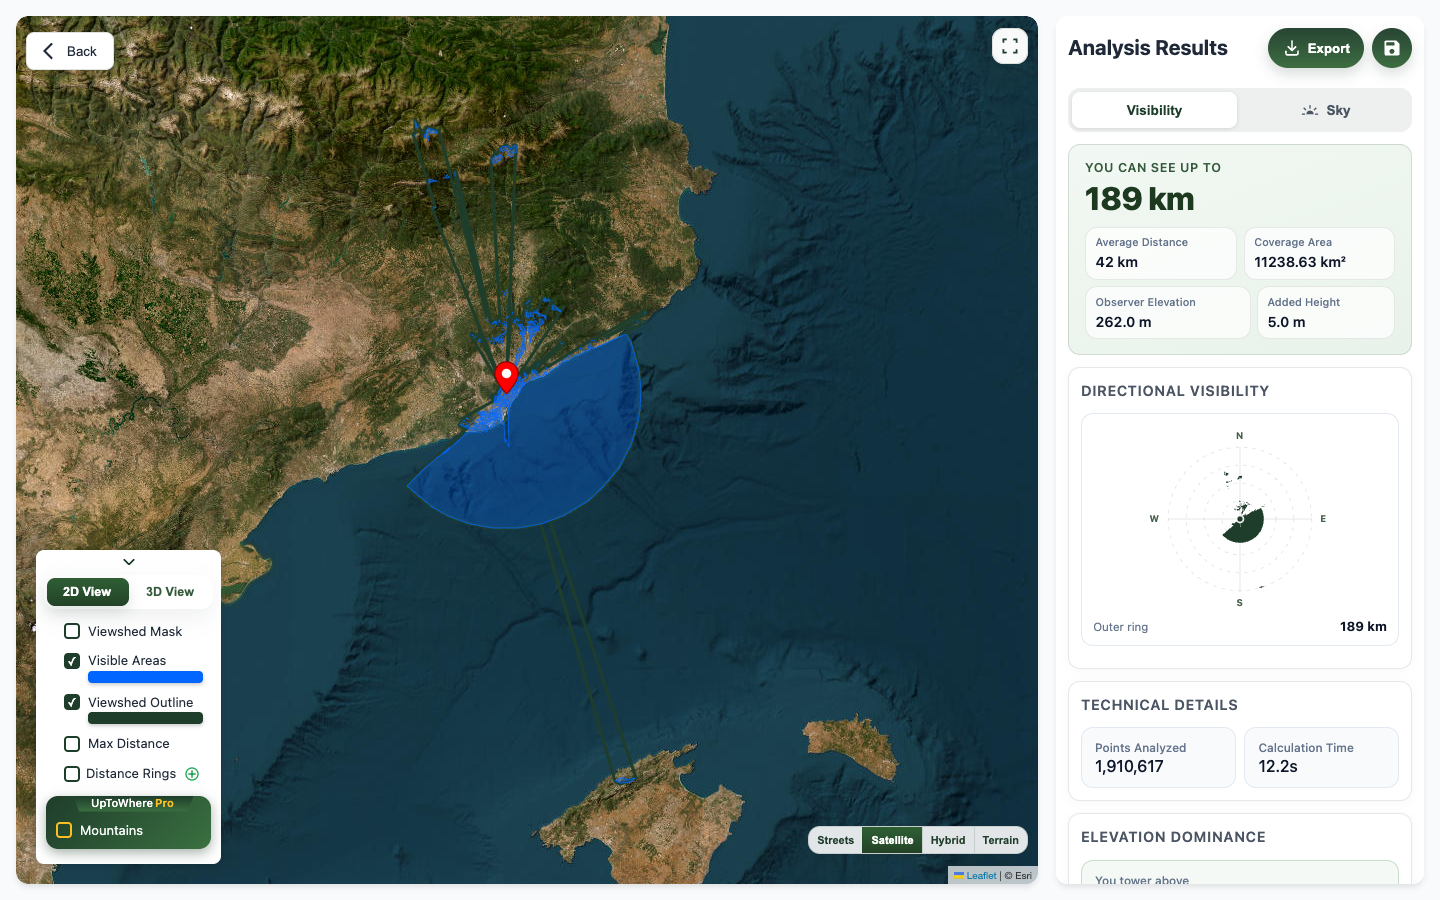
Drop a pin anywhere on the planet and UpToWhere traces a line of sight along every compass bearing, walking the terrain profile out to 1,000 km. The result is a map of everything the landscape allows you to see:
- Maximum and average visible distance, direction by direction
- The single farthest point of terrain in view, with its bearing, distance and elevation
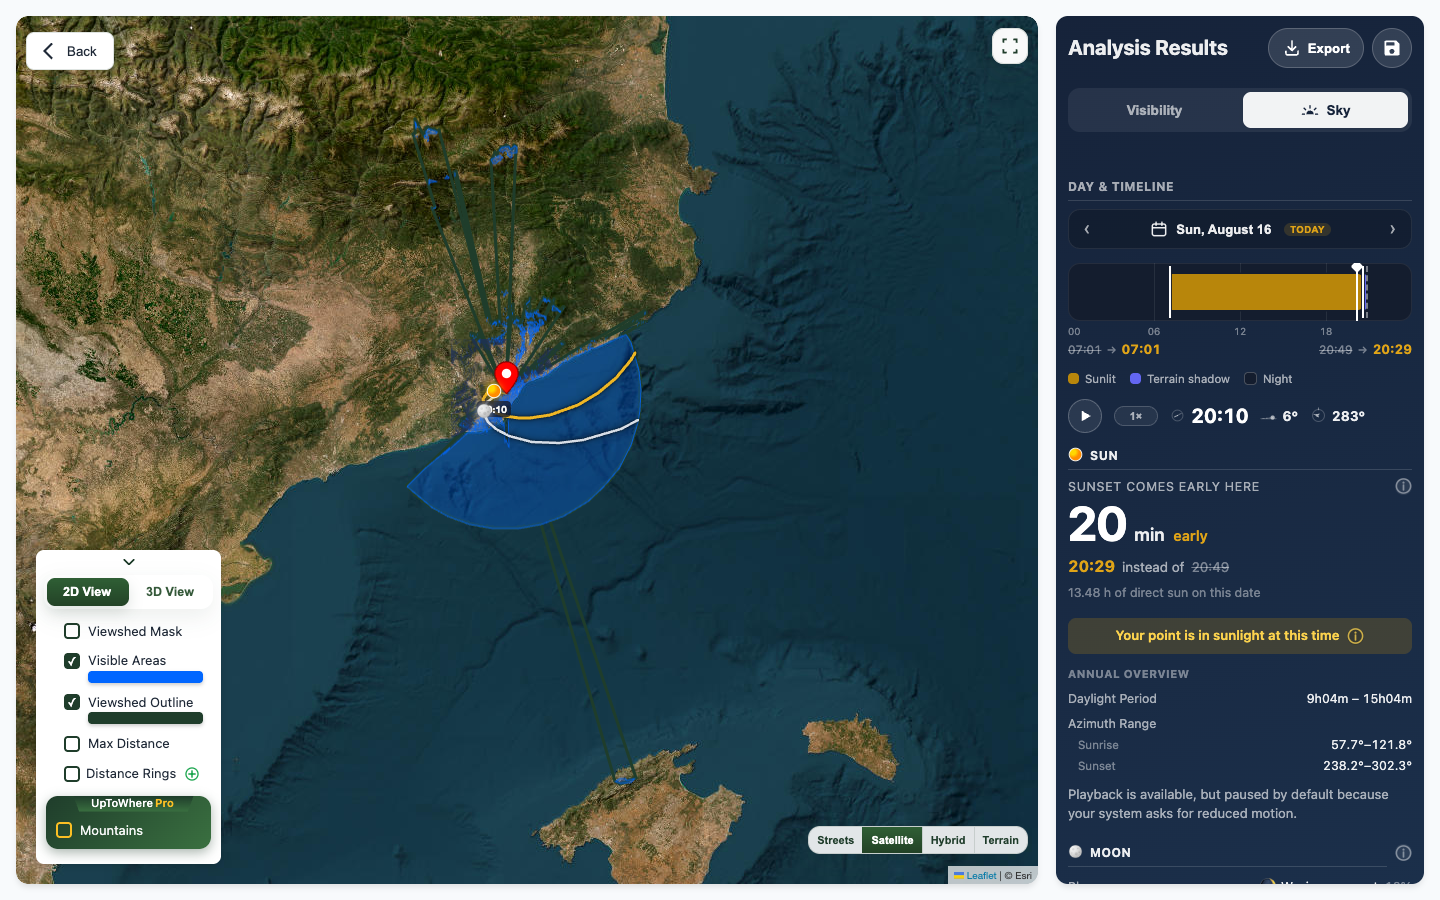
- Where the sun rises and sets over your visible horizon, any day of the year
Point-to-point line of sight
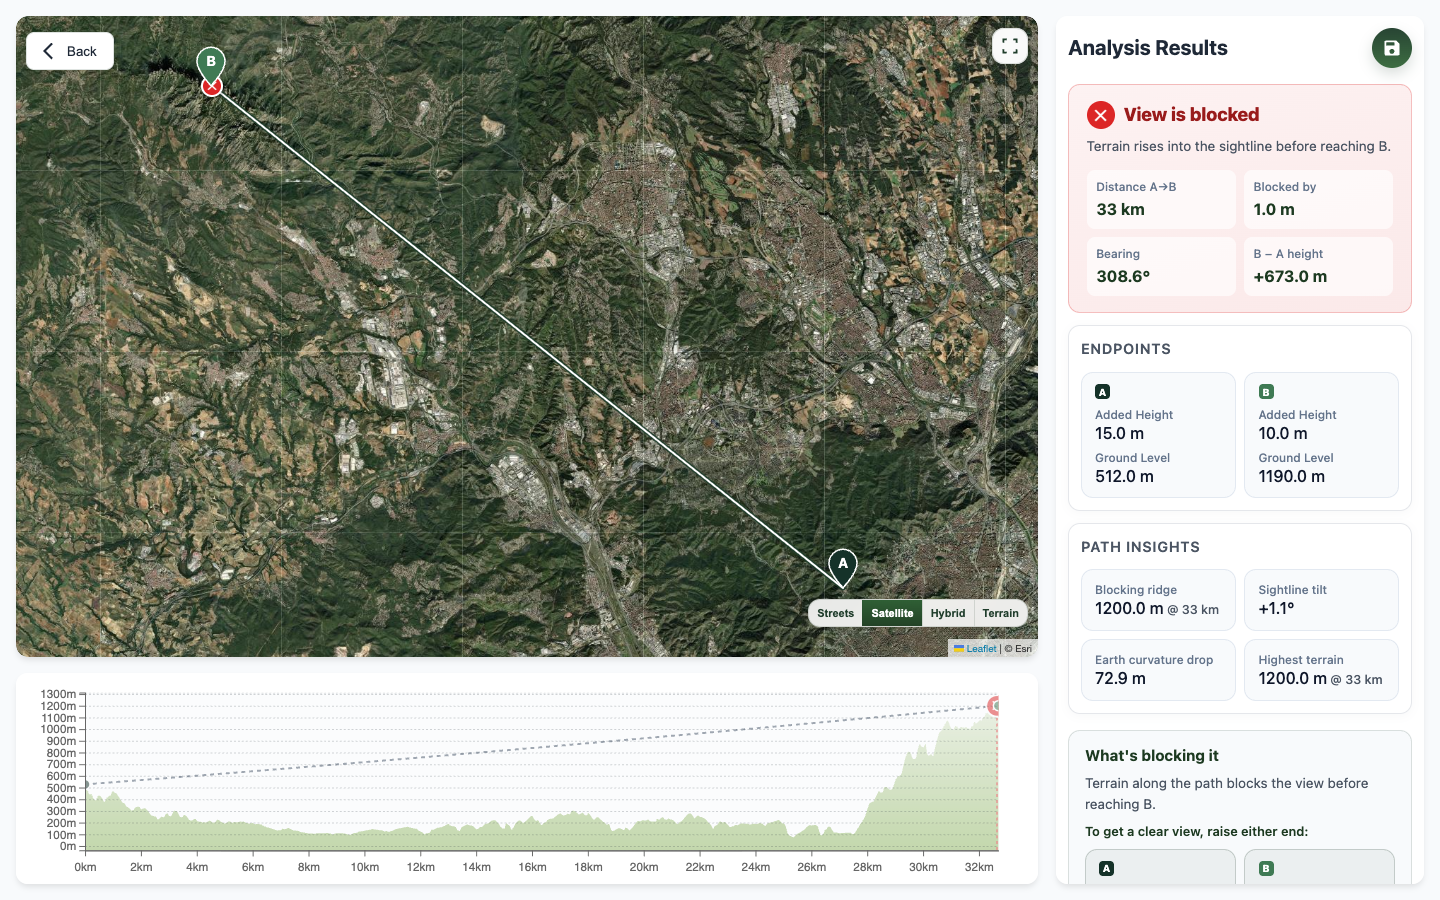
Give it two points (a roof and a summit, a plot of land and the sea, two antenna sites) and it walks the terrain between them to answer a yes-or-no question honestly:
- Whether the two points can see each other, corrected for curvature and refraction
- The full elevation profile between them, with the blocking ridge identified
- Adjustable observer and target heights: add a mast, a tower, a second floor
The science: curvature and refraction
Over real distances, the shape of the Earth matters more than intuition suggests. The math is a century old and solid: the value is in applying it to every sightline at once.
The Earth falls away
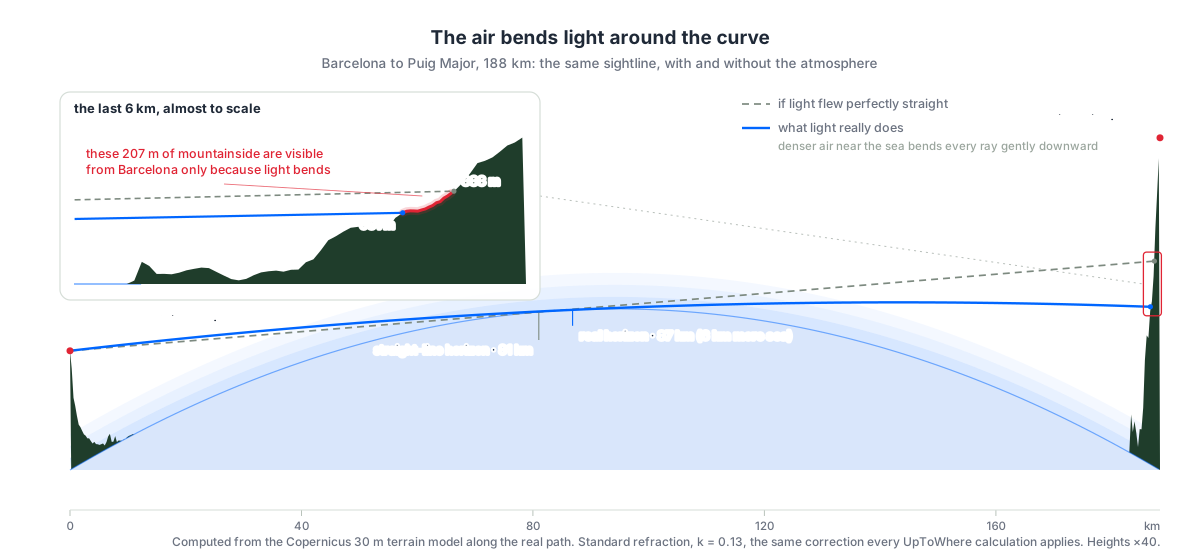
Every sightline loses height to curvature: about 8 centimeters over the first kilometer, 7.8 meters at 10 km, nearly 200 meters at 50 km. That hidden-height drop is why a shoreline disappears before the hills behind it, and why a lower summit can block a taller one far beyond. UpToWhere subtracts it along the entire terrain profile of every ray it traces.
The air bends light back
The atmosphere refracts light downward, so you see slightly past the geometric horizon. UpToWhere applies the standard surveying correction (a refraction coefficient of 0.13, equivalent to computing on a planet about 15% larger), the same convention used in geodesy and radio planning. Over long distances it stretches visibility by roughly 7%.
The data: Copernicus GLO-30
One elevation model for the whole planet
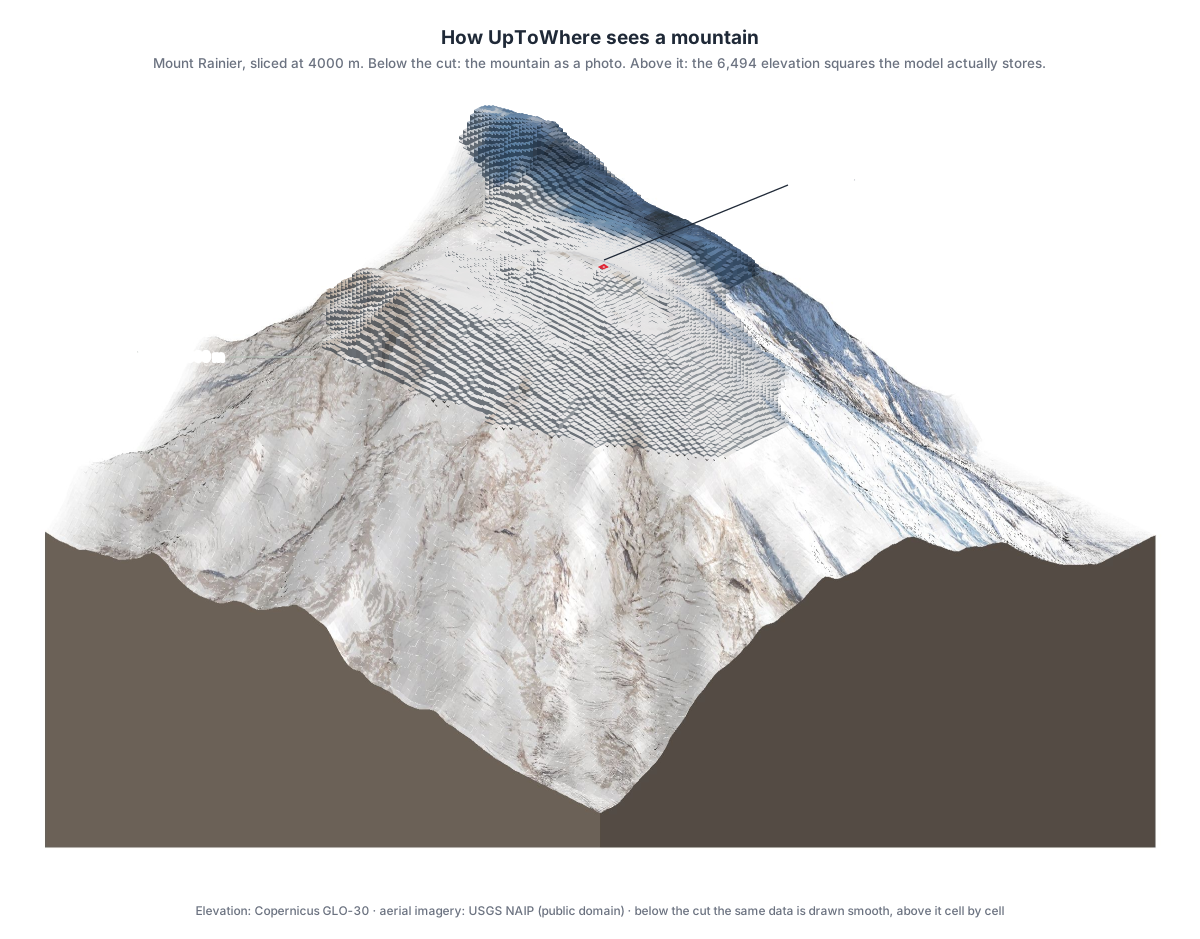
Every calculation runs on Copernicus GLO-30, the European Space Agency's global 30-meter digital elevation model, built from the TanDEM-X radar satellite mission. It covers essentially every landmass at consistent quality (the same dataset used by mapping agencies and researchers worldwide), with typical vertical accuracy within a few meters.
What 30 meters buys you
A terrain sample every 30 meters is fine enough to catch the specific ridge that cuts off your view, not just the mountain range it belongs to. A single 100 km sightline samples thousands of elevation points; a full 360° viewshed at maximum range evaluates millions. All of it is computed server-side in seconds.
Where the answers stop
A tool you can trust has to be clear about what it does not model.
Terrain, not buildings or trees
GLO-30 is a radar surface model: solid ground is captured faithfully, but individual buildings and vegetation are not treated as obstacles along your sightline. In a city or a dense forest, read the result as the view from slightly above the local clutter: a rooftop rather than the street.
Clear-sky maximums
Results are the terrain-limited maximum: what the geometry of the planet permits on a perfectly transparent day. Haze, humidity and dust usually shorten real visibility well below it. The longest sightline ever photographed (443 km, from the Pyrenees to the Alps) needed exceptional air to match what the terrain had allowed all along.
What people use it for
Scouting and planning
Most questions are some form of "is the view worth it?", answered before traveling, climbing or buying:
- Finding summits with a clear low horizon for the August 2026 total eclipse over Spain
- Checking whether a property really has the sea view the listing promises
- Knowing which peaks you'll see from a summit before committing to the climb
Technical sightlines
The same terrain walk answers harder-edged questions, where an obstruction costs money:
- Terrain clearance between two antenna or repeater sites, at the exact mast heights you plan to build
- Visual line of sight for drone operations
- Coverage comparison for lookout towers, cameras and sensors
UpToWhere Pro
The free calculator answers a 20 km horizon. Pro removes the radius cap and adds the tools that make a result usable: the Sky tab, named peaks, point-to-point checks and KML export.
Frequently asked questions
How far can a person actually see?
Standing at sea level, your horizon is about 5 km away. From 100 m up it grows to roughly 37 km; from a 3,000 m summit, to about 200 km. The record for a photographed sightline is 443 km, from Pic de Finestrelles in the Pyrenees to Pic Gaspard in the Alps: geometry the terrain always allowed, captured on a day the atmosphere finally cooperated.
How accurate are the results?
The terrain model has a 30-meter grid and typical vertical accuracy within a few meters, and every calculation corrects for Earth curvature and standard atmospheric refraction. Sightlines that clear or hit an obstacle decisively are very reliable; one that grazes a ridge by a meter or two is genuinely borderline in reality as well, and a small change in observer height can flip it. It is a model, not a survey: where something depends on the answer, check it on the ground.
Does it account for buildings and trees?
No: the analysis is terrain-only. Copernicus GLO-30 is a surface model, so forests and cities influence its elevations in places, but individual buildings and trees are not modeled as view blockers. In built-up or forested areas, treat the result as the view from above the local obstructions.
What's the difference between the viewshed and point-to-point mode?
The 360° viewshed asks "what can this point see?" and traces every direction outward. Point-to-point asks "can these two specific points see each other?" and walks the single terrain profile between them, showing exactly where a sightline fails and by how much. The first is for discovering views; the second is for verifying one.
Is UpToWhere free?
The core 360° viewshed is free, with a radius of up to 20 km. UpToWhere Pro removes that cap and adds point-to-point checks, the Sky tab, named peaks, KML/KMZ export and priority processing. Studio sits on top of Pro for bulk sites, link matrices and cumulative maps.
Where does the elevation data come from?
From Copernicus GLO-30, the European Space Agency's global 30-meter digital elevation model, derived from the TanDEM-X radar mission. It is the reference global elevation dataset in current use, covering essentially all land on Earth.
Why does adding a few meters of observer height change so much?
Near the horizon, sightlines run almost tangent to the terrain, so a small lift clears obstacles that were barely winning. Two extra meters can reveal kilometers of new ground, which is exactly why fire lookouts sit on towers instead of standing on the summit rock beneath them.
Can it show me where the sun will rise and set?
Yes. For any location and date, the viewshed includes the sun's rising and setting positions over your actual visible horizon, including whether a mountain will hide the true sunrise. It's how people are scouting west-facing viewpoints for the total solar eclipse crossing Spain on 12 August 2026, which happens with the sun low over the horizon.
Why does the analysis stop at 1,000 km?
Because beyond that, the answer stops being about terrain. Even the most extreme theoretical sightlines on Earth run around 500–550 km, and the atmosphere almost never stays transparent that far. A 1,000 km radius comfortably contains every sightline that can physically exist.